Examples of Visual Facilitation and Recording
Visual Facilitation and Visual Recording can benefit a great number of people, companies and organisations. Here are some example of how I have helped others.
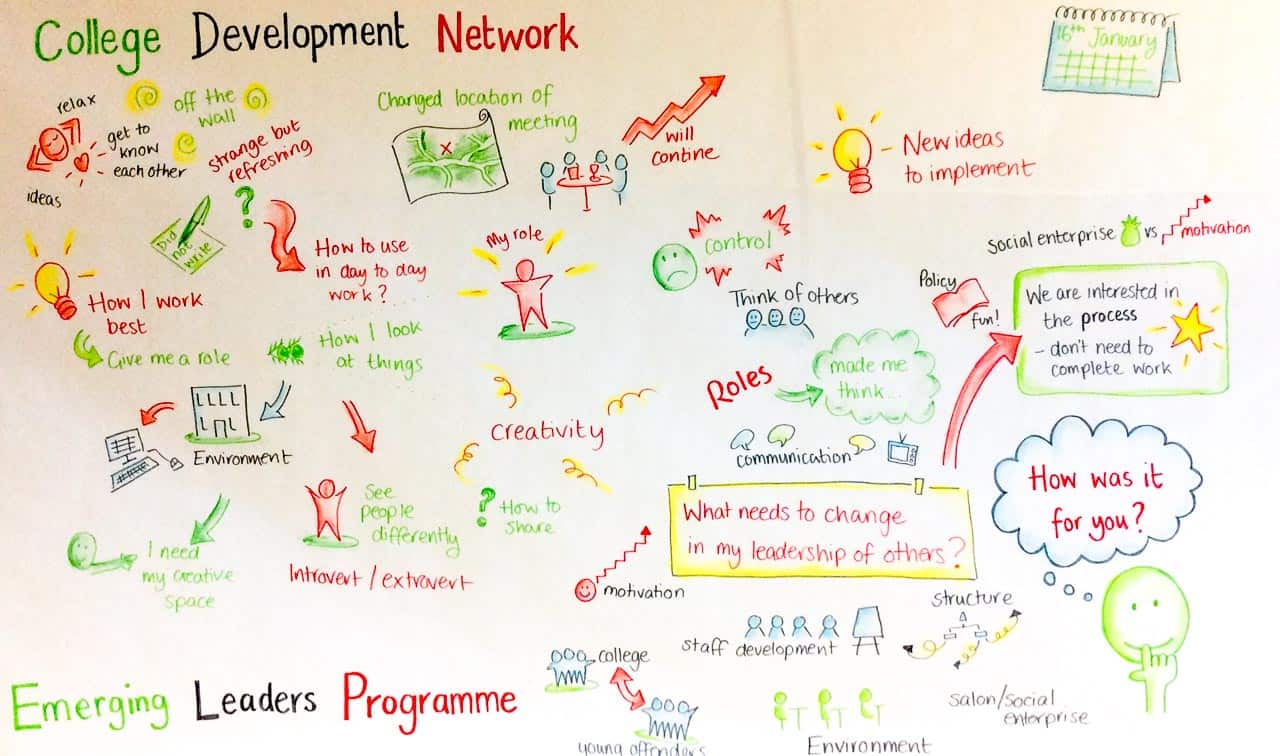
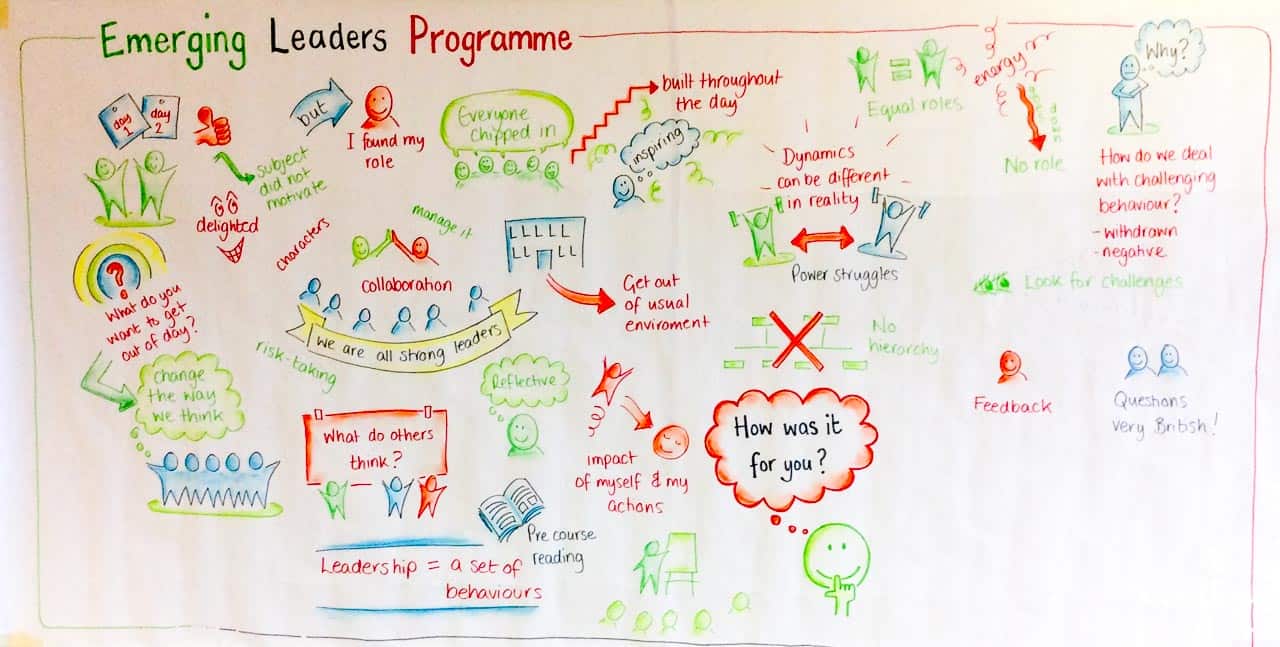
College Development Network
| Problem | Emerging Leaders across Scotland’s Colleges unclear as to how to include team members in planning using creative techniques. |
| Method | Live demonstration and training on team planning and problem solving approaches where all members experienced the process and contributed to creation of large graphic. |
| Outcome | Provided toolbox of approaches that can be used for building motivated teams and transparent, collaborative planning. |
College Development Network engaged me to provide Visual Facilitation and Team Planning Training as part of their Emerging Leaders Course. I provided a whistle-stop tour in 1 day covering:
- Benefits of using live drawings
- Demonstrated how to plan with your team and truly involve them
- Introduced and taught the beginnings of their visual vocabulary
- Shared every day techniques to discover team member’s gifts
- Practical problem solving session that encourages and relies upon team involvement
The group were surprised at their abilities to produce live visuals and were very enthusiastic about taking it back and trying out together with their respective teams. A number of participants used the skills learned to plan out future projects, they reported that working in this way brought their teams together, developed working relationships and improved participation resulting in stronger plans and more ownership of tasks.
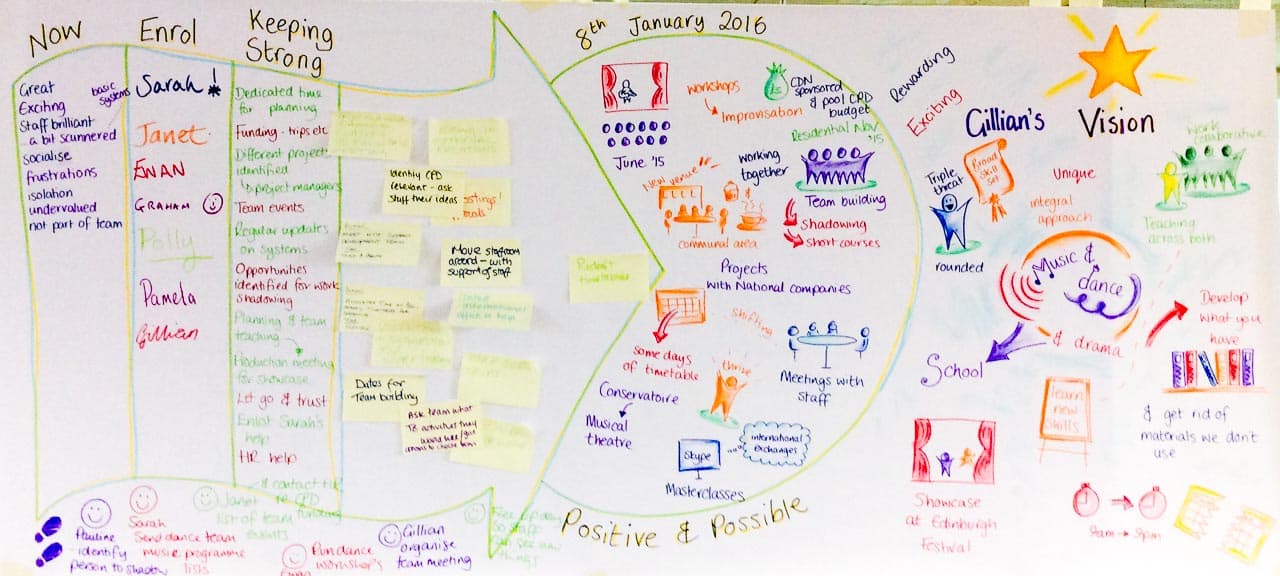
Three of the participants brought me into their respective colleges to work alongside them involving their team, and sometimes wider teams in strategic planning, designing a new website and exploring college values.
Again, feedback showed that staff involved in the meetings felt listened to and were motivated to take part, making plans and solving problems together. Many of the participants advised that it was a much better way to conduct meetings as it held their interest and they enjoyed it!
Scottish Community Development Centre (SCDC)
| Problem | Unsure of all the assets and facilities in the Portree and Braes area. |
| Method | Used group discussion to explore community’s knowledge of places, people, facilities, etc., to create a large colour coded graphic “map”. |
| Outcome | Provided clarity of what is and isn’t available in the Portree and Braes area which informed action to take in developing the area. |
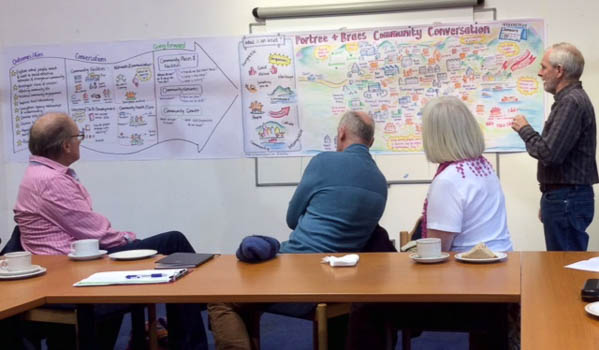
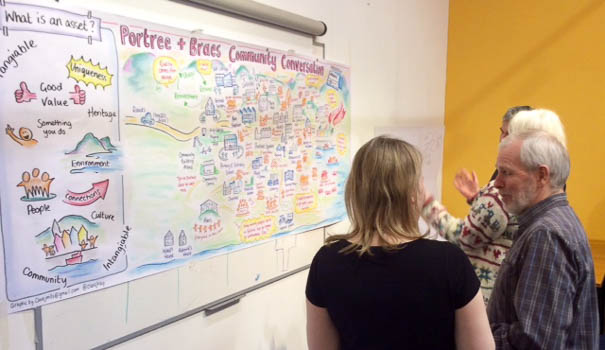
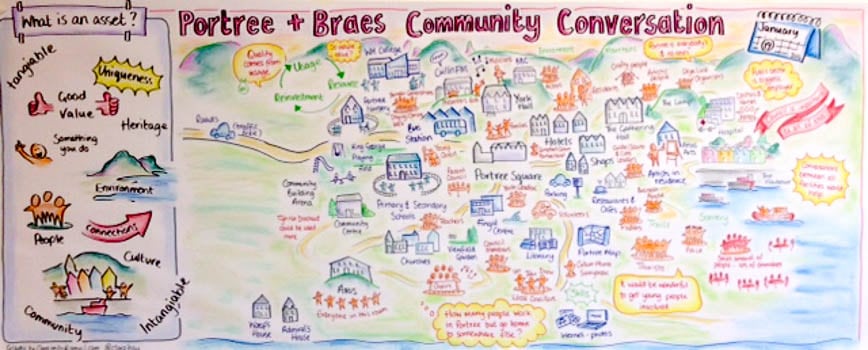
Scottish Community Development Centre (SCDC) asked me to make a visual record of their Portree and Braes Community Conversation.
Two meetings took place and I made a visual record of each. The first meeting mapped out the areas assets and facilities. I drew a map of Portree and Braes and recorded every place, person and facility that was discussed. The second meeting was to review and generate ideas for moving forward. I worked quietly at the side recording all discussions visually.
The two graphic charts have been displayed in a community exhibition to share the story so far and generate more interest. They have been very helpful in communicating what’s been happening and engaging the community to take action.
Stirling University Student Union
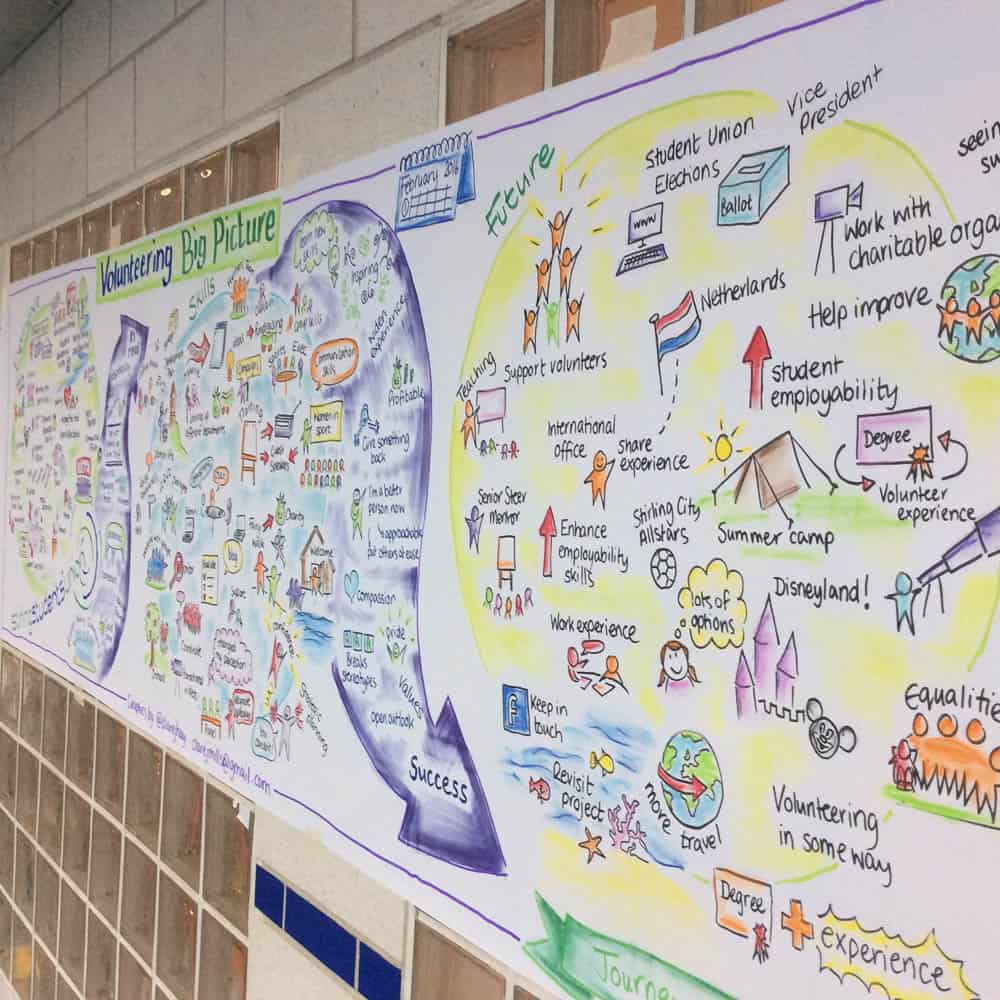
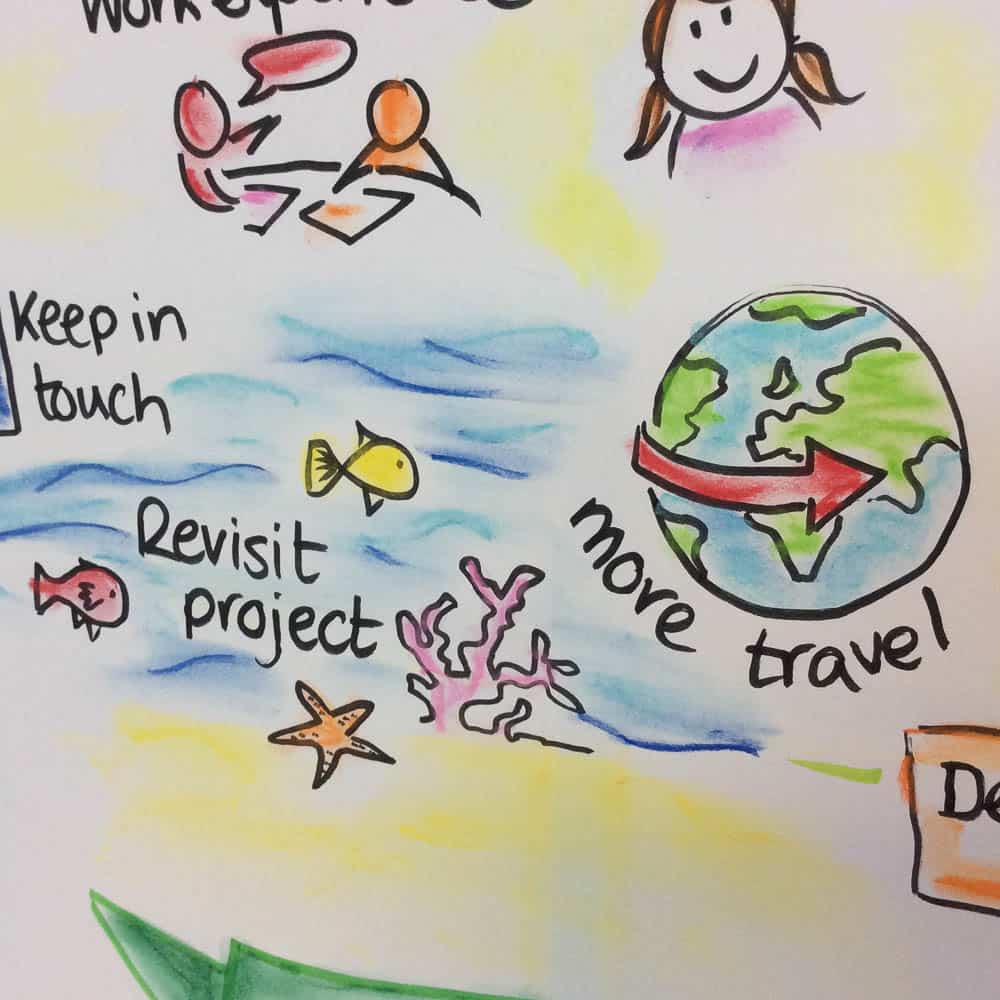
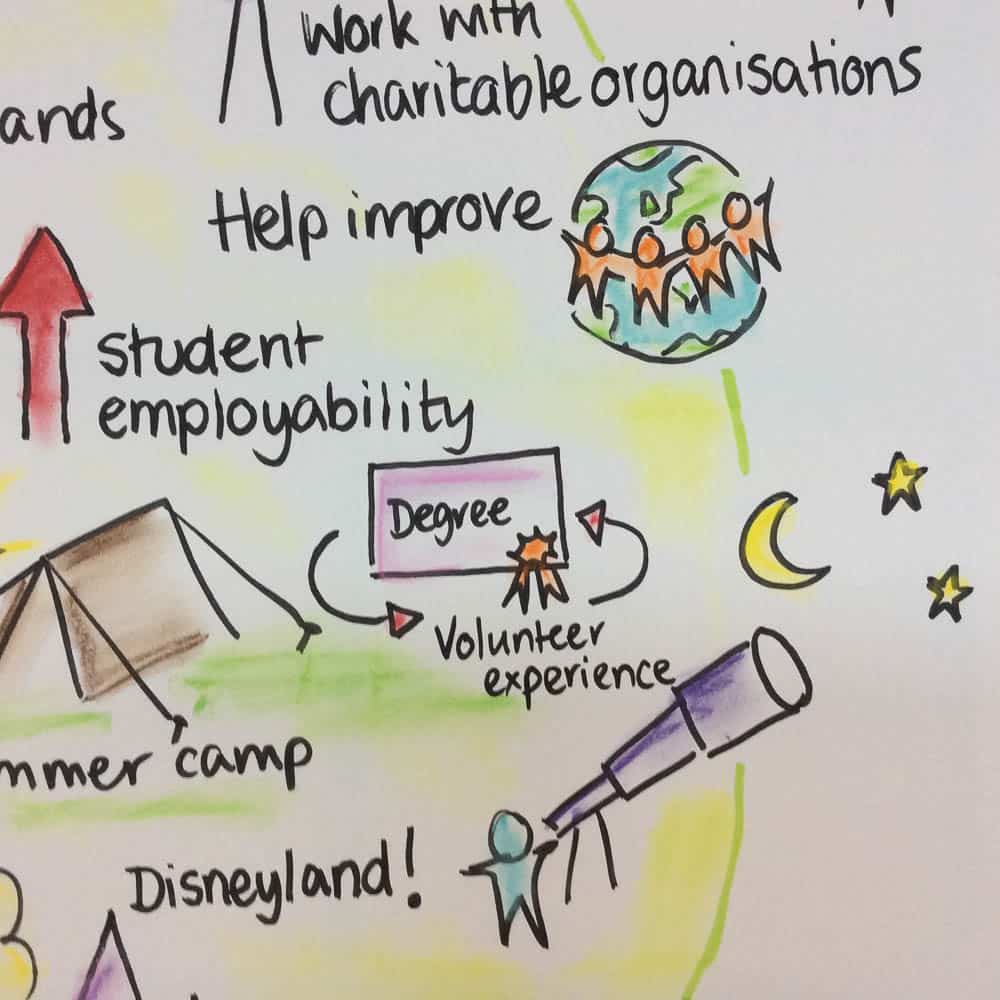
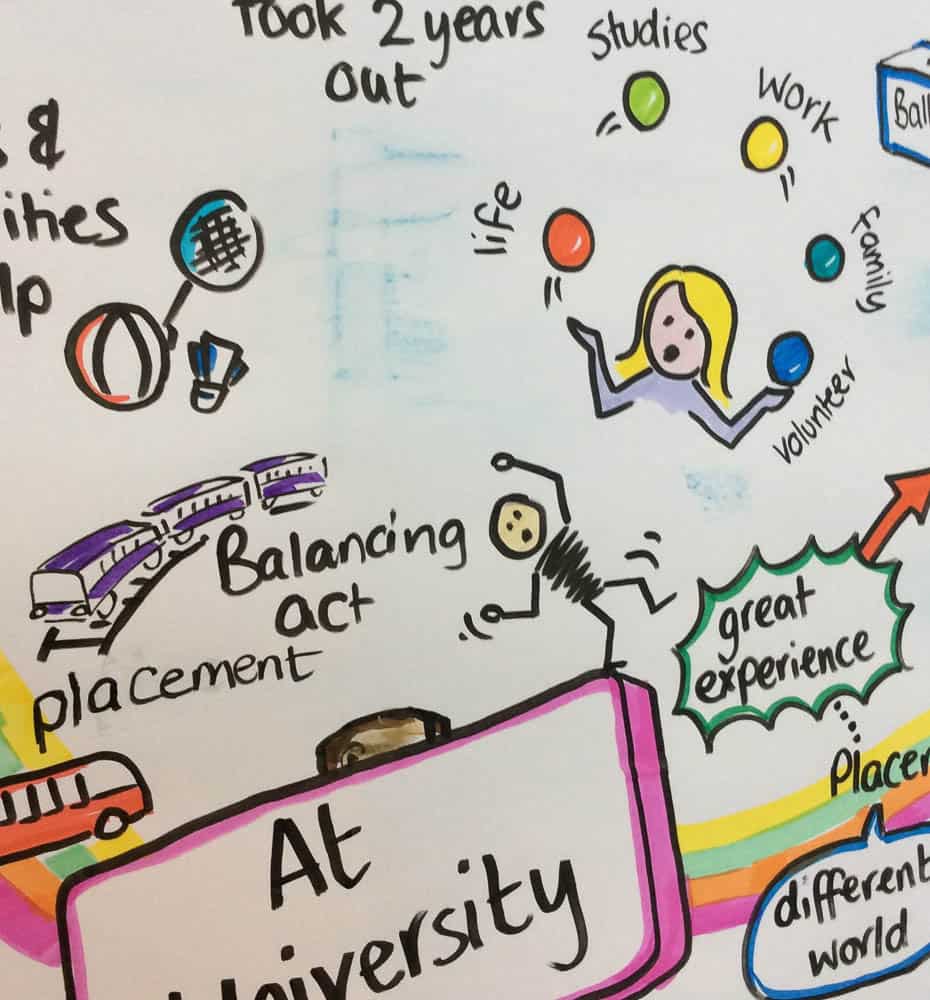
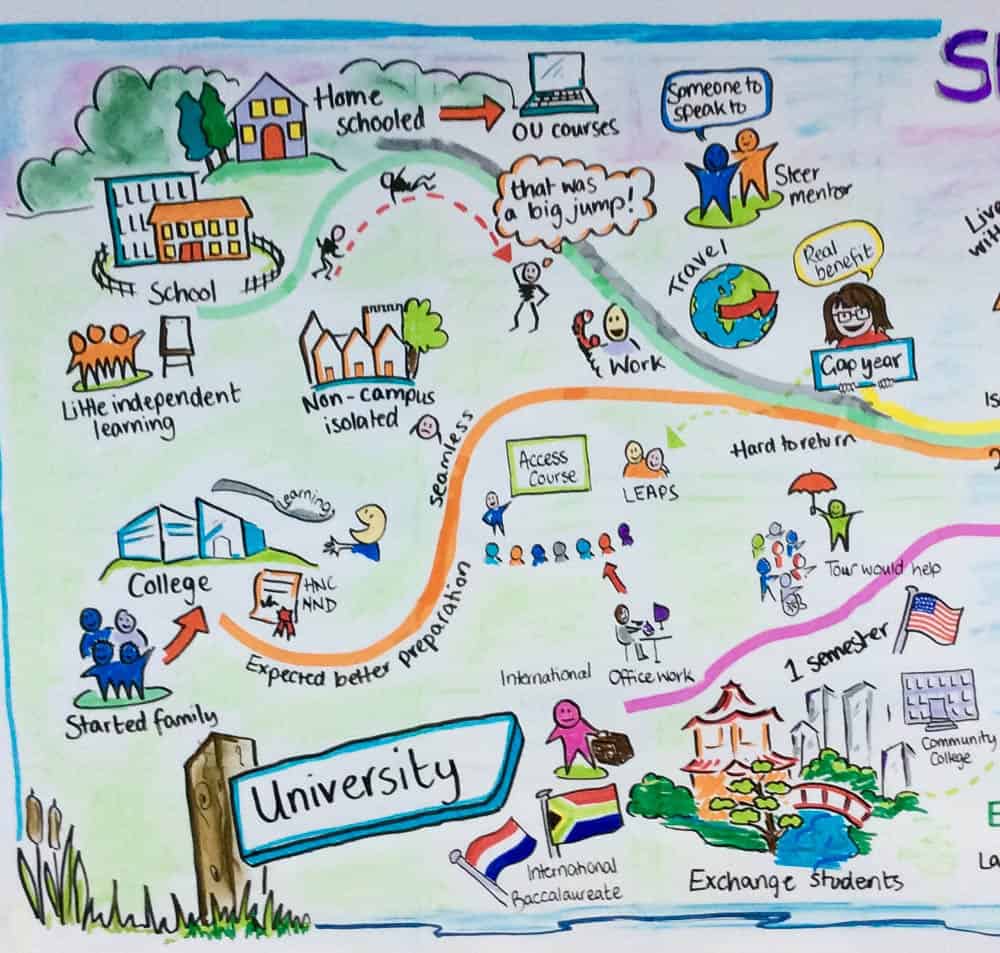
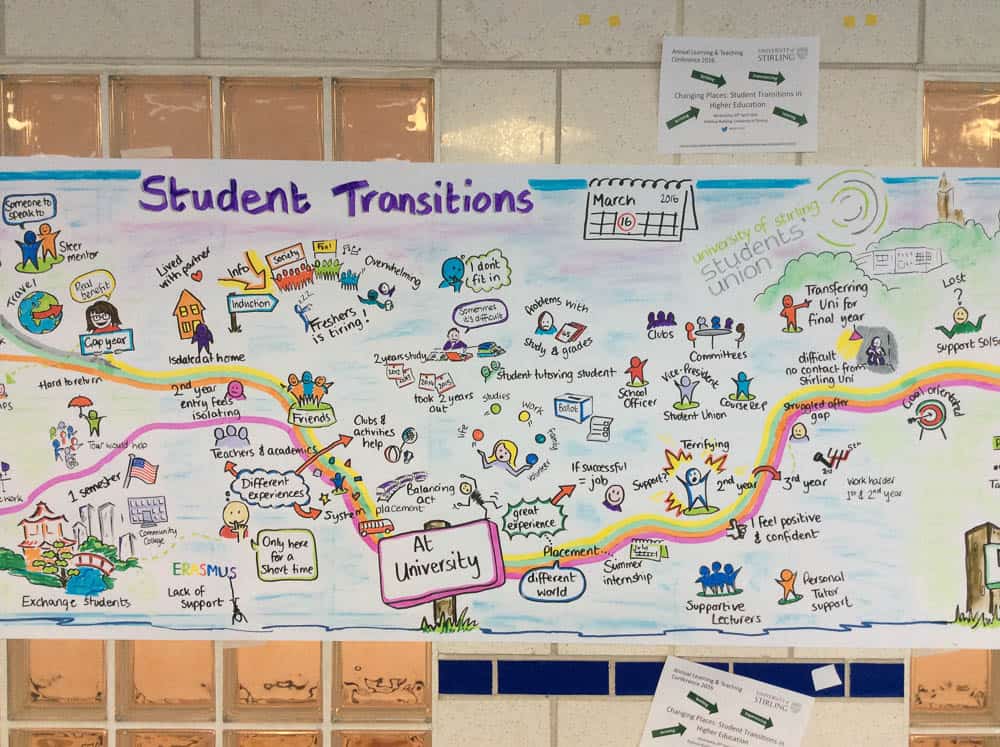
| Problem | Wanted to find out about student’s transitions into, throughout and after university. |
| Method | Provided a visual facilitation service in a public area asking passers by questions and drawing up answers on large graphic chart. |
| Outcome | Clear overview of the many routes in, through and out of university which tells a collective story in an engaging and creative way. |
Stirling University asked me to help them gather research on all the transitions that students experience on their university journey. I set up in a busy corridor over lunch time when it would be at its busiest.
A team of helpers from the Student Union asked passers by questions and I drew them up on the paper, we got through lots of post it notes!
Working in this way generated a lot of interest and buzz meaning the researchers got to ask many people about their experiences and the participants enjoyed their stories being visualised.
The final graphic chart will be used to communicate findings back to management and wider still. It demonstrates not just one story but a multitude of different voices. The plan is to take it to a national conference to share the findings.
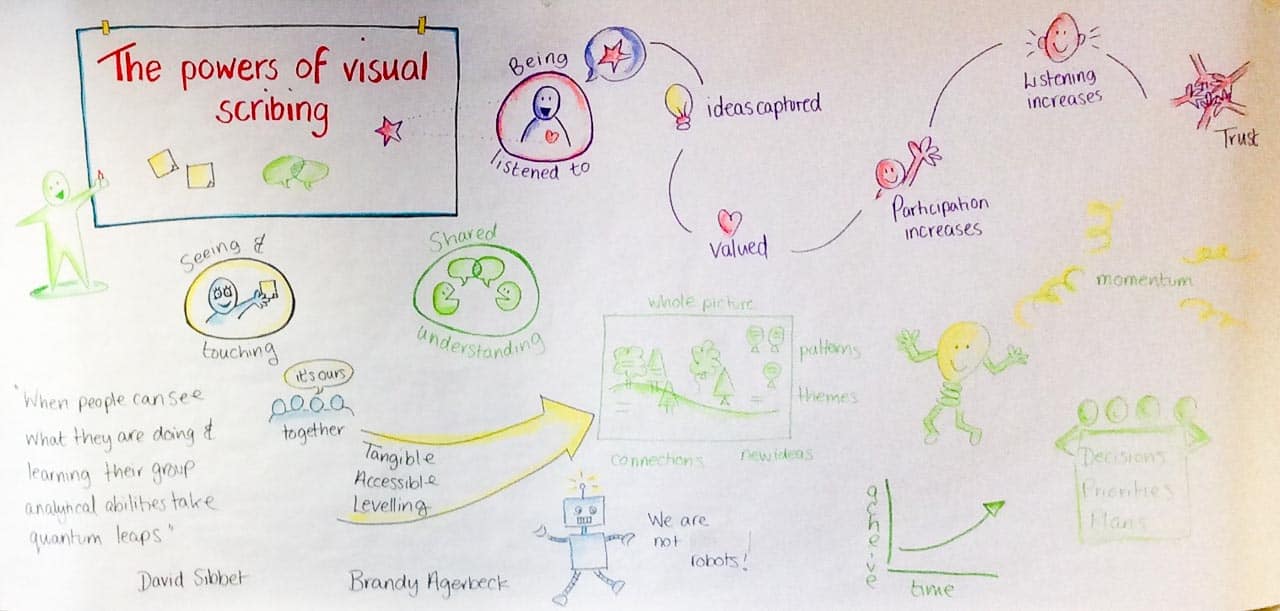
If you can talk about it, I can draw it!
- Events and conferences
- Consultations and research
- Stakeholder engagement and public participation
- Strategic planning and visioning